Production performance diagnosis for Python engineers

Find the bottleneck.

Cut your infrastructure bill.

Make it faster, and prove by how much.

Find the memory leak.

Read a flame graph.

Know what to fix first.

Layer by layer, from the API down to the database.

The whole first chapter is open. No account, no card, nothing to fill in.

Written by a backend engineer: ten years of Python, five of them freelancing, at Alma, Back Market, among others.

  • Python
  • FastAPI
  • PostgreSQL
  • Redis
  • OpenTelemetry

Stop guessing. Diagnose first, fix second.

First, find where the problem comes from. Measure, isolate, prove: you point at the cause and show the numbers behind it, instead of arguing about likely suspects.

Then, fix it, with the limits stated. No course covers every possible fix. What you get: pointers, the notions each fix rests on, and the bottlenecks that come up again and again.

Throughout, chapters that stand on their own, each recapping what it needs. Quizzes, real cases on your own stack, cheat sheets to keep.

Real data, not a mock-up

You will learn to read these. They pinpoint the problem.

We built the classic broken endpoint: sync SQLAlchemy inside async def, plus an N+1, filled the database with 500,029 rows, and profiled it for real. Every tab is the actual output of the actual tool, and each one points at the same culprit.

Samples the call stack a few thousand times per second and shows where the time settles. Cheap enough to run on real traffic.

statistical profiler
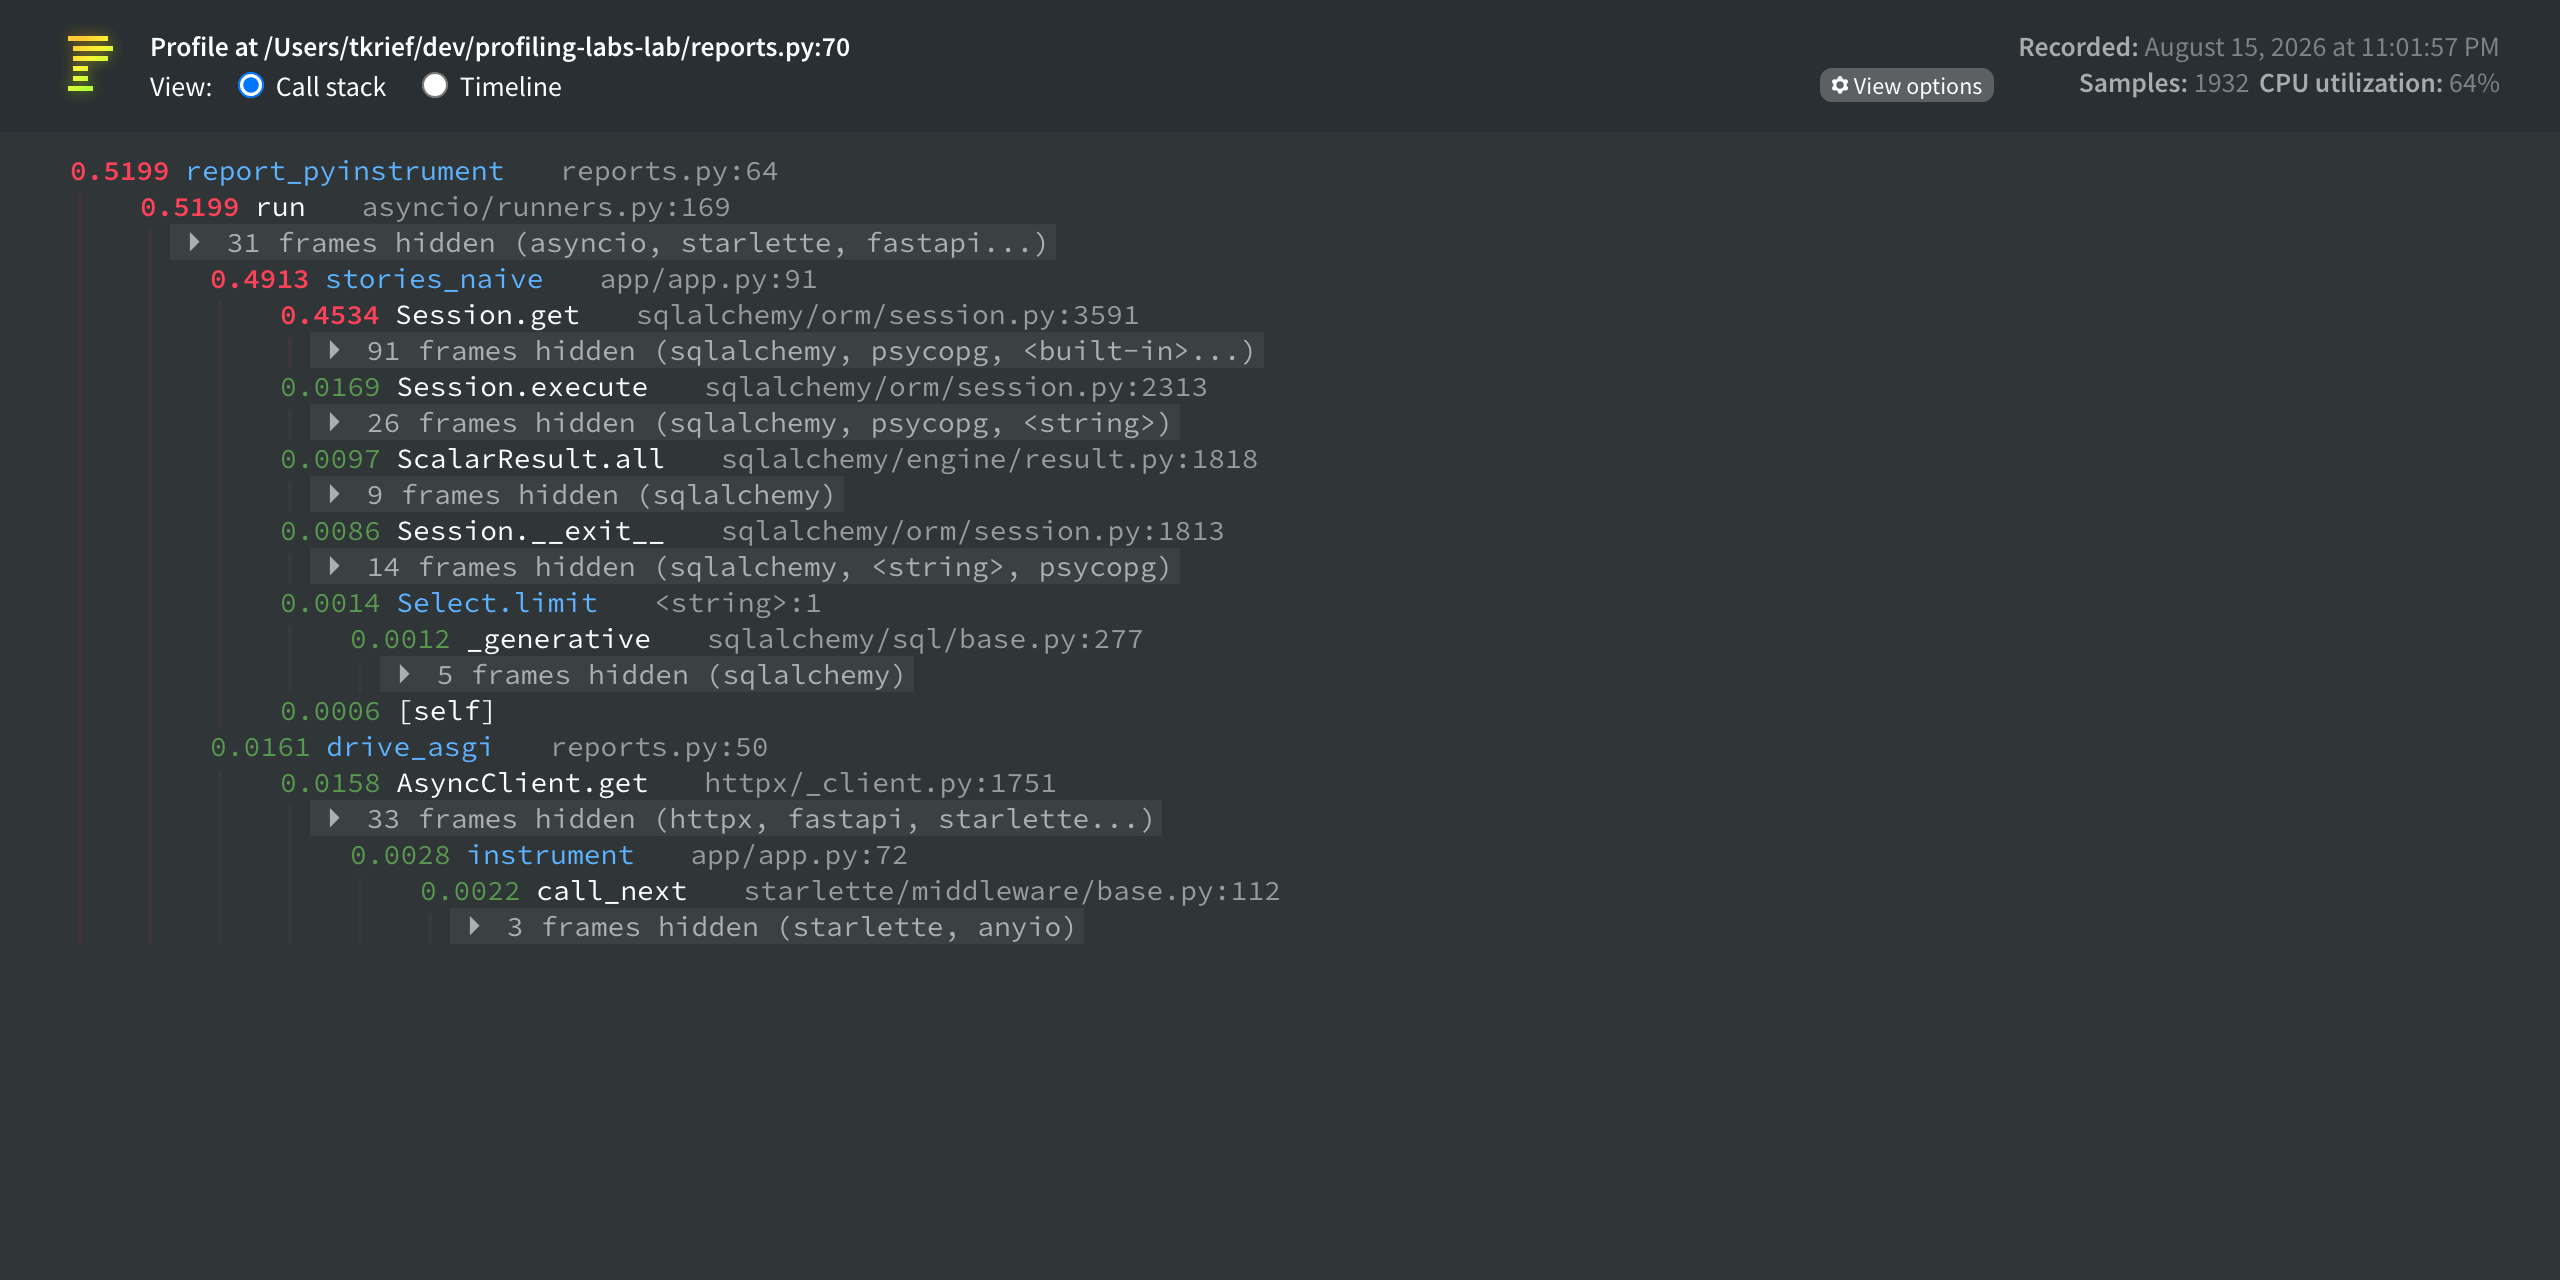
pyinstrument output for the naive endpoint

→ Session.get holds 0.45s of a 0.52s capture: the per-row author lookup is the request.

The tools you will know how to read

Reading a query

Read a SQLAlchemy query and know, before running it, what it will ask the database and how many times.

Browser dev tools

Interpret what the dev tools already tell you. There is a lot to learn there before you open a single profiler.

Profilers

Use several profilers, deterministic and statistical, and know what each one sees, what it misses and what it costs.

Visualising a profile

Turn a raw profile into something you can read: flame graphs, call trees, and the frame that actually holds the time.

Import time

Monitor what your application pays on import, and cut down how long it takes to start.

Query profiler

Read what a request really sent: spot an N+1, a full scan, a query that runs long, and the plan behind it.

The method

Measure, isolate, prove, fix, instrument

Five steps, always in that order. Skipping one is how a week disappears into the wrong layer.

01

Measure

Find where the time actually goes, before forming any opinion about it.

02

Isolate

Narrow it down to one layer, one component, one call. Rule the others out with a number.

03

Prove

Confirm the hypothesis with a profile, a query plan or a trace. A plausible cause is not a cause.

04

Fix

Make the smallest change that moves the measurement, then measure again.

A real investigation

One endpoint, measured before and after

Same data returned, same machine, same code path. The only difference is that someone looked at where the time went instead of guessing.

GET /stories/naive?limit=50
SQL queries / request 51
p50 120ms
p99 130ms
throughput 84req/s

Measured with ab -n 600 -c 10 against FastAPI + sync SQLAlchemy inside async def, PostgreSQL 17, 500,029 rows. Flip the switch.

Who it is for

This is a course for people who already ship

This is for you if

  • You write Python and maintain APIs in production
  • You are the one who gets asked why an endpoint got slow
  • You work with FastAPI, Django, Flask or something close
  • You know SQL, and want to get much better at reading what the engine did
  • You have access to logs, traces or metrics, or can put them in place
  • You want a method you can repeat, not a list of tricks

This is not for you if

  • You are learning Python
  • You have never built an API
  • You are looking for a beginner FastAPI course
  • You only want a list of optimisations to apply blindly
  • You are after computer science theory rather than production practice

Free, right now

Chapter one is open. Go watch it.

Not a trailer, not a teaser: the entire first chapter, the same videos paying students get. You profile plain Python scripts, parallelise them, meet the GIL where it actually bites, and finish on a challenge that takes one slow script from 17 seconds to under 2. Judge the course on the real thing.

Start watching, free →

No account, no card, no email. The player opens on the first lesson.

The chapters

Seven chapters, one method

Start with what a profiler really records, on plain scripts, then carry the same method to a running API, find the component at fault, fix it on real cases, and instrument so it never surprises you twice.

Chapter 01 Free

Profiling, from first principles

Before touching an API: what a profiler actually records, how to read its output on a small script, and why the first fix you reach for (threads) sometimes does nothing at all.

  • What profiling is, what it measures, and what it cannot tell you
  • Your first profile, on something real: a script that is slow for a reason you do not know yet
  • Set up the exercise environment: uv, the course repository, the same scripts on your machine
  • Parallelise the downloads with threads, measure, and see exactly what changed
  • The GIL, explained through what you just measured: when threads help and when they do not
  • Profile async code with pyinstrument, and find out why it goes blind on threads
  • Trace the threads with VizTracer, and read what every one of them actually ran
  • A full challenge: one slow script taken from 17 seconds to under 2, measured at each step
pyinstrumentVizTracerThreadsGIL
coming soon

Chapter 02

Profiling the API

Same method, now on a running service. Deterministic profilers record every call and slow the run down. Statistical ones sample and cost almost nothing. Knowing which to reach for, and how to read the numbers that come out, is the skill.

  • Mean, median, p50, p95, p99: what each says and what it hides
  • Wall clock time against CPU time, latency against throughput
  • Read the browser dev tools first: often the answer is already there
  • Deterministic and statistical profilers: what each sees, misses and costs
  • cProfile, pyinstrument, py-spy, and attaching to a process in production
  • Wire a profiling middleware into your routes, and keep it off the hot path
  • Decide from the profile whether you are IO bound or CPU bound
  • Visualise the result: flame graphs, call trees, own time against cumulative
  • Profile SQLAlchemy and import time
PercentilescProfilepy-spyFlame graphs
coming soon

Chapter 03

Hands on: fix it

You do not learn to diagnose by watching someone else do it. This chapter hands you broken endpoints and you fix them, one at a time, measuring before and after.

  • Real cases to fix yourself: IO bound, CPU bound, and the ones that are both
  • async def or def: what each does with your handler, and when def wins
  • What blocks the event loop, and how it looks in a profile before and after
  • Move IO to asyncio, move CPU to multiprocessing or a dedicated worker
  • Background tasks and fire-and-forget: what you gain, what you give up
  • The GIL and the event loop, explained through what you just measured
asyncioGILMultiprocessingWorkers
coming soon

Chapter 04

When it is the database

The profile is clear: your code is not the problem, the database is. Now what? This is where you learn to read what the engine actually did, and to change it.

  • Read an execution plan line by line: scans, joins, sorts, loops, buffers
  • Compare estimated against actual, and know what the gap means
  • Index types and when each applies: partial, composite, covering, GIN
  • Spot an N+1 by counting queries, without reading the code
EXPLAINIndexesN+1PostgreSQL
coming soon

Chapter 05

Observability at scale

Instrument once, and stop hunting. A request that crosses several services should tell you where its time went before you have to go looking for it.

  • Instrument a Python stack with OpenTelemetry
  • Trace id, span id, context propagation: follow one request across services
  • Workers, queues and microservices: keep the thread of a request through all of it
  • Dashboards that fit on one screen, and alerts on signals that matter
OpenTelemetryTrace idSpan idAlerting
coming soon

Chapter 06

Load testing

A load test tells you where the tail sits and what gives way first. It does not tell you what your users are living. This chapter is about that difference.

  • Design a scenario that resembles your traffic, not a synthetic best case
  • Run it and read what comes out: throughput, percentiles, error rate
  • Find the breaking point, and what gives way first
  • Tell a real regression apart from noise in the numbers
Load testingThroughputPercentilesBreaking point
coming soon

Chapter 07

Tips, tricks and going further

The things that do not fit a chapter of their own, and the toolkit you keep after the course.

  • Track down a memory leak, and tell it apart from a cache filling up
  • git bisect on a performance regression: script the measurement, let it find the commit
  • Tune Uvicorn, Gunicorn and Hypercorn: workers, processes, what to set them to
  • FastAPI tips that pay off, and the traps that cost
  • Compression, HTTP/2 and QUIC: what each changes for an API
  • When leaving Python pays: Rust, Cython, and when it does not
  • Speed up your own test suite
  • Build the scripts, prompts and cheat sheets you will reuse on your own stack
MemoryUvicornFastAPITooling
coming soon
Téva Krief

Who wrote it

Téva Krief

Backend engineer, ten years of Python · @teva_krief

Ten years of Python, five of them freelancing: a payments company, a marketplace, a Swiss insurer, and my own SaaS products shipped end to end. Different stacks, different team sizes, the same recurring scene: an endpoint slows down, everyone has a theory, and a week goes into the wrong layer. What I teach here is what I ended up doing instead, on real production systems: measure first, isolate, prove it, and only then change the code. I build my own tooling for backend analytics and API response times, and I teach diagnosis the way I run it.

Writing Python was never the scarce part

It gets less scarce every year. Plenty of people can write a FastAPI endpoint, and plenty of tools will write one for them. What almost nobody can do is take an endpoint that is slow in production, work out where the time actually goes, and prove it with a number.

For you

A skill you can name, prove, charge for, and take with you

In an interview, in a performance review, on a freelance quote: you are not saying you know Python, you are saying you take an endpoint apart and come back with the layer, the number and the fix.

"Checkout went from 2.1 s to 140 ms. The profile showed the request sitting on send_email, so it moved to a background task. Here is the profile before, and here it is after."

For your team

One method, instead of five opinions per incident

The cost is not the slowdown itself: it is the three engineers investigating three different hypotheses, the infrastructure added to buy silence, and the one person every performance question ends up on. Training the team on one shared method is how that stops.

  • "The API is slow" stops being an opinion and becomes a measurement
  • Either a real bottleneck to fix, or capacity you stop paying for
  • A new engineer diagnoses without a senior beside them

The expensive part isn't the course. It's guessing.

Performance problems become expensive when teams debug them without evidence.

2 days

Optimizing the wrong thing

A slow endpoint looks like a database problem. You add indexes, rewrite queries, and change the ORM. The real bottleneck was somewhere else.

€400 / month

Paying for a problem you never found

The service is slow, so you scale the infrastructure. It gets better until it doesn’t. You are now paying for capacity instead of understanding the bottleneck.

4 engineers

Four people, four hypotheses

Everyone has a theory about what is slow. Without the right profiling and observability skills, the team is debugging blindly.

Every time

The same investigation, from scratch

Nothing was instrumented and nothing was written down, so the problem comes back six months later and one senior engineer is pulled off their roadmap to find it again.

Get notified

Two ways to learn it

The same recorded course sits under both. One you take on your own; the other is run with your team, with the sessions and the questions that go with it. Chapter 1 is already open, free, no account needed. The rest is being recorded: leave your email and I will tell you the day it opens.

For individual engineers

Learn the skill.

Self-paced. Lifetime access, every update included.

  • The complete video course, every chapter
  • Hands-on exercises against a running application
  • Performance debugging case studies
  • Templates, checklists and reference sheets
  • Every update, for as long as the course exists

Nothing to pay today. Joining the list holds the launch price for you, and the only email you get is the one announcing the opening.

Or start chapter 1 now, free →

For engineering teams

Train the team.

Scoped to your team size and your stack.

  • The full video course, for every engineer on the team
  • A private team workspace, each engineer at their own pace
  • Two to three live sessions with the instructor
  • Private Q&A on problems from your own production
  • Light adaptation of the examples to your stack

Leave a work email. I answer with a few questions about the team and what you are running, then a scope.